


Notebooks

Categories


Cells
Premium

BioTuring
Cell2location is a principled Bayesian model that can resolve fine-grained cell types in spatial transcriptomic data and create comprehensive cellular maps of diverse tissues. Cell2location accounts for technical sources of variation and borrows statistical strength across locations, thereby enabling the integration of single cell and spatial transcriptomics with higher sensitivity and resolution than existing tools. This is achieved by estimating which combination of cell types in which cell abundance could have given the mRNA counts in the spatial data, while modelling technical effects (platform/technology effect, contaminating RNA, unexplained variance).
This tutorial shows how to use cell2location method for spatially resolving fine-grained cell types by integrating 10X Visium data with scRNA-seq reference of cell types. Cell2location is a principled Bayesian model that estimates which combination of cell types in which cell abundance could have given the mRNA counts in the spatial data, while modelling technical effects (platform/technology effect, contaminating RNA, unexplained variance).

BioTuring
Spatially resolved gene expression profiles are key to understand tissue organization and function. However, spatial transcriptomics (ST) profiling techniques lack single-cell resolution and require a combination with single-cell RNA sequencing (scRNA-seq) information to deconvolute the spatially indexed datasets.
Leveraging the strengths of both data types, we developed SPOTlight, a computational tool that enables the integration of ST with scRNA-seq data to infer the location of cell types and states within a complex tissue. SPOTlight is centered around a seeded non-negative matrix factorization (NMF) regression, initialized using cell-type marker genes and non-negative least squares (NNLS) to subsequently deconvolute ST capture locations (spots).
Simulating varying reference quantities and qualities, we confirmed high prediction accuracy also with shallowly sequenced or small-sized scRNA-seq reference datasets. SPOTlight deconvolution of the mouse brain correctly mapped subtle neuronal cell states of the cortical layers and the defined architecture of the hippocampus. In human pancreatic cancer, we successfully segmented patient sections and further fine-mapped normal and neoplastic cell states.
Trained on an external single-cell pancreatic tumor references, we further charted the localization of clinical-relevant and tumor-specific immune cell states, an illustrative example of its flexible application spectrum and future potential in digital pathology.
BioTuring
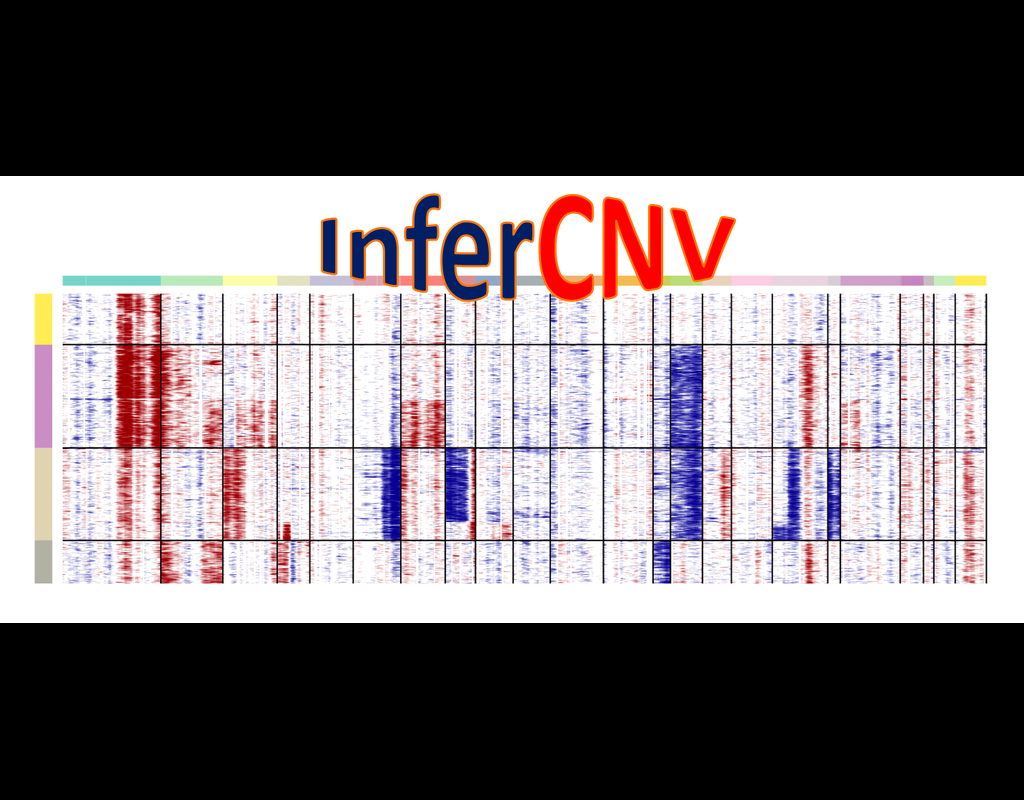
InferCNV is used to explore tumor single cell RNA-Seq data to identify evidence for somatic large-scale chromosomal copy number alterations, such as gains or deletions of entire chromosomes or large segments of chromosomes. This is done by exploring expression intensity of genes across positions of tumor genome in comparison to a set of reference 'normal' cells. A heatmap is generated illustrating the relative expression intensities across each chromosome, and it often becomes readily apparent as to which regions of the tumor genome are over-abundant or less-abundant as compared to that of normal cells.
**Infercnvpy** is a scalable python library to infer copy number variation (CNV) events from single cell transcriptomics data. It is heavliy inspired by InferCNV, but plays nicely with scanpy and is much more scalable.

BioTuring
Mapping out the coarse-grained connectivity structures of complex manifolds
Biological systems often change over time, as old cells die and new cells are created through differentiation from progenitor cells. This means that at any given time, not all cells will be at the same stage of development. In this sense, a single-cell sample could contain cells at different stages of differentiation. By analyzing the data, we can identify which cells are at which stages and build a model for their biological transitions.
By quantifying the connectivity of partitions (groups, clusters) of the single-cell graph, partition-based graph abstraction (PAGA) generates a much simpler abstracted graph (PAGA graph) of partitions, in which edge weights represent confidence in the presence of connections.
In this notebook, we will introduce the concept of single-cell Trajectory Analysis using PAGA (Partition-based graph abstraction) in the context of hematopoietic differentiation.
Trends
BioTuring
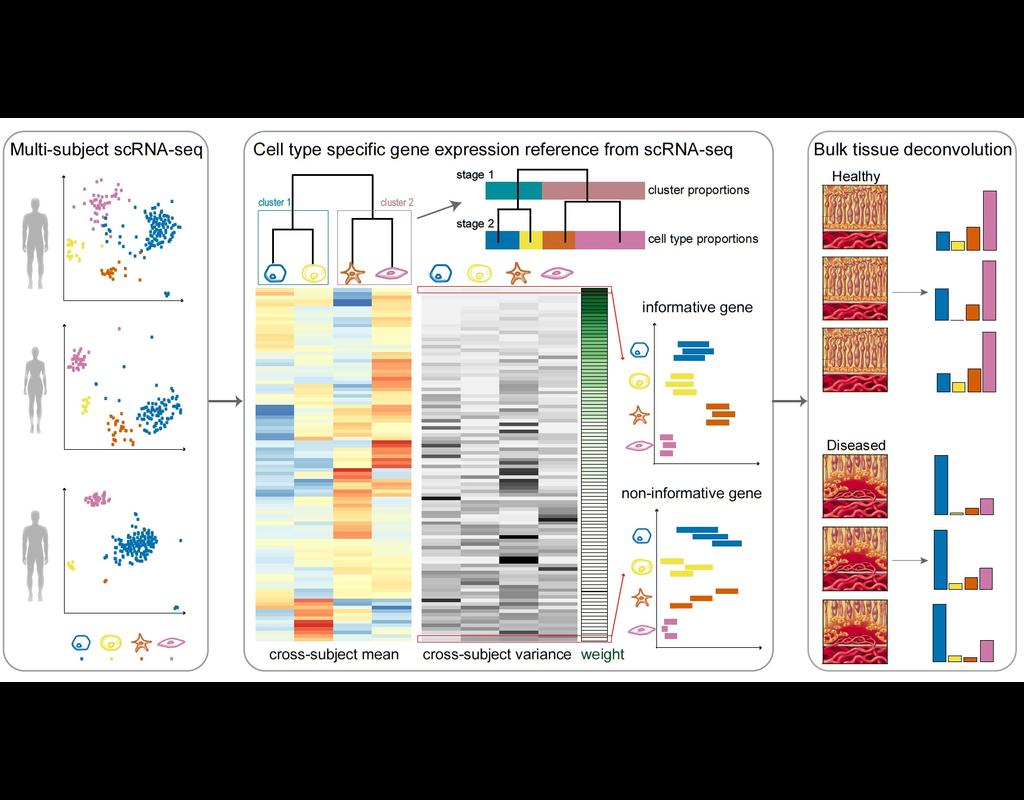
Knowledge of cell type composition in disease relevant tissues is an important step towards the identification of cellular targets of disease. MuSiC is a method that utilizes cell-type specific gene expression from single-cell RNA sequencing (RNA-seq(More)