


Notebooks

Categories


Cells
Premium


BioTuring
In this notebook, we present COMMOT (COMMunication analysis by Optimal Transport) to infer cell-cell communication (CCC) in spatial transcriptomic, a package that infers CCC by simultaneously considering numerous ligand–receptor pairs for either spatial transcriptomic data or spatially annotated scRNA-seq data equipped with spatial distances between cells estimated from paired spatial imaging data.
A collective optimal transport method is developed to handle complex molecular interactions and spatial constraints. Furthermore, we introduce downstream analysis tools to infer spatial signaling directionality and genes regulated by signaling using machine learning models.
BioTuring
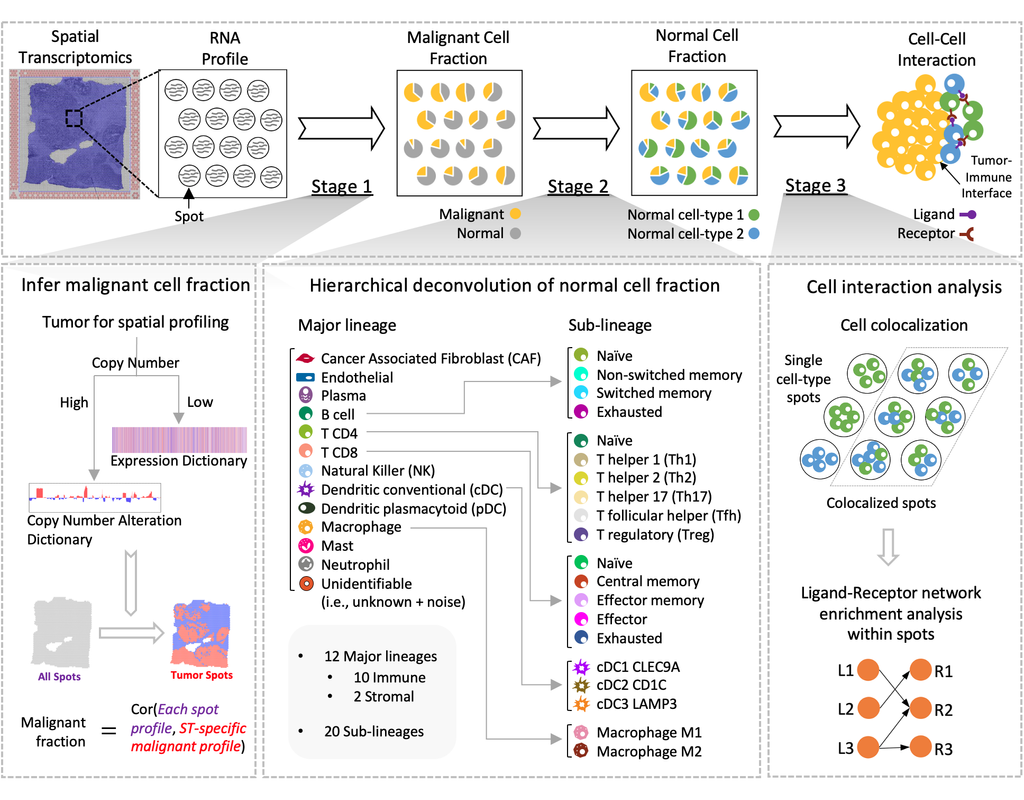
Spatial transcriptomics (ST) technology has allowed to capture of topographical gene expression profiling of tumor tissues, but single-cell resolution is potentially lost. Identifying cell identities in ST datasets from tumors or other samples remains challenging for existing cell-type deconvolution methods.
Spatial Cellular Estimator for Tumors (SpaCET) is an R package for analyzing cancer ST datasets to estimate cell lineages and intercellular interactions in the tumor microenvironment. Generally, SpaCET infers the malignant cell fraction through a gene pattern dictionary, then calibrates local cell densities and determines immune and stromal cell lineage fractions using a constrained regression model. Finally, the method can reveal putative cell-cell interactions in the tumor microenvironment.
In this notebook, we will illustrate an example workflow for cell type deconvolution and interaction analysis on breast cancer ST data from 10X Visium. The notebook is inspired by SpaCET's vignettes and modified to demonstrate how the tool works on BioTuring's platform.

BioTuring
Single-cell RNA sequencing (scRNA-seq) data have allowed us to investigate cellular heterogeneity and the kinetics of a biological process. Some studies need to understand how cells change state, and corresponding genes during the process, but it is challenging to track the cell development in scRNA-seq protocols. Therefore, a variety of statistical and computational methods have been proposed for lineage inference (or pseudotemporal ordering) to reconstruct the states of cells according to the developmental process from the measured snapshot data. Specifically, lineage refers to an ordered transition of cellular states, where individual cells represent points along. pseudotime is a one-dimensional variable representing each cell’s transcriptional progression toward the terminal state.
Slingshot which is one of the methods suggested for lineage reconstruction and pseudotime inference from single-cell gene expression data. In this notebook, we will illustrate an example workflow for cell lineage and pseudotime inference using Slingshot. The notebook is inspired by Slingshot's vignette and modified to demonstrate how the tool works on BioTuring's platform.
BioTuring
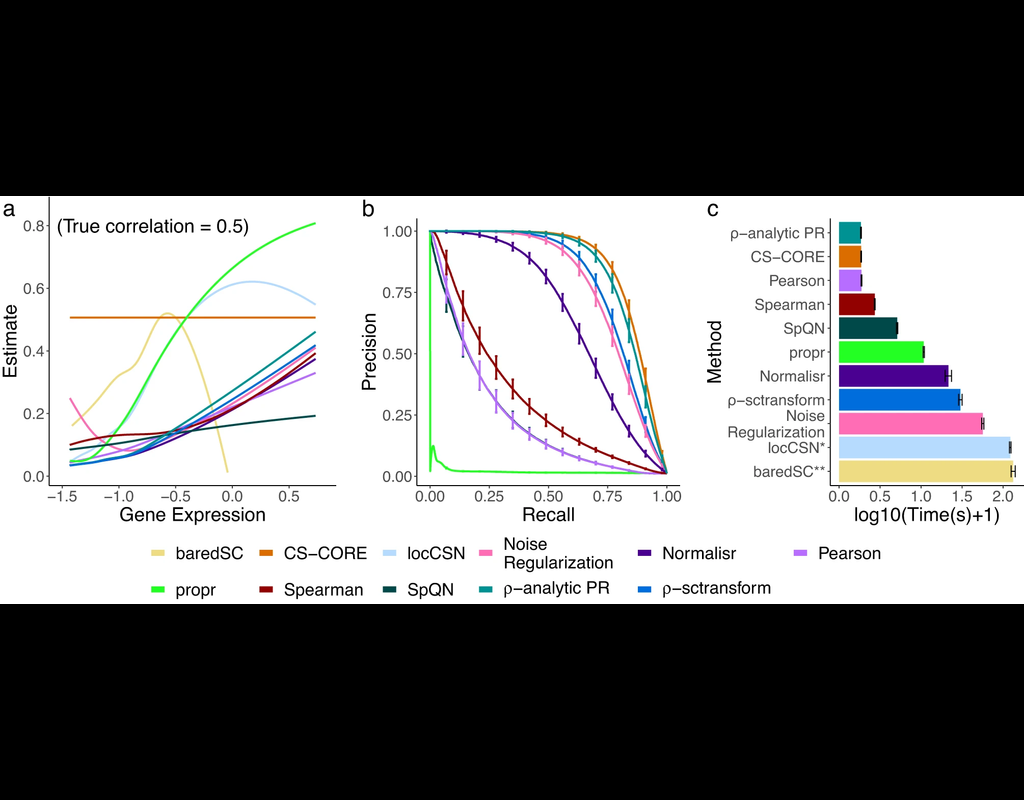
The recent development of single-cell RNA-sequencing (scRNA-seq) technology has enabled us to infer cell-type-specific co-expression networks, enhancing our understanding of cell-type-specific biological functions. However, existing methods proposed for this task still face challenges due to unique characteristics in scRNA-seq data, such as high sequencing depth variations across cells and measurement errors.
CS-CORE (Su, C., Xu, Z., Shan, X. et al., 2023), an R package for cell-type-specific co-expression inference, explicitly models sequencing depth variations and measurement errors in scRNA-seq data.
In this notebook, we will illustrate an example workflow of CS-CORE using a dataset of Peripheral Blood Mononuclear Cells (PBMC) from COVID patients and healthy controls (Wilk et al., 2020). The notebook content is inspired by CS-CORE's vignette and modified to demonstrate how the tool works on BioTuring's platform.
Trends
BioTuring
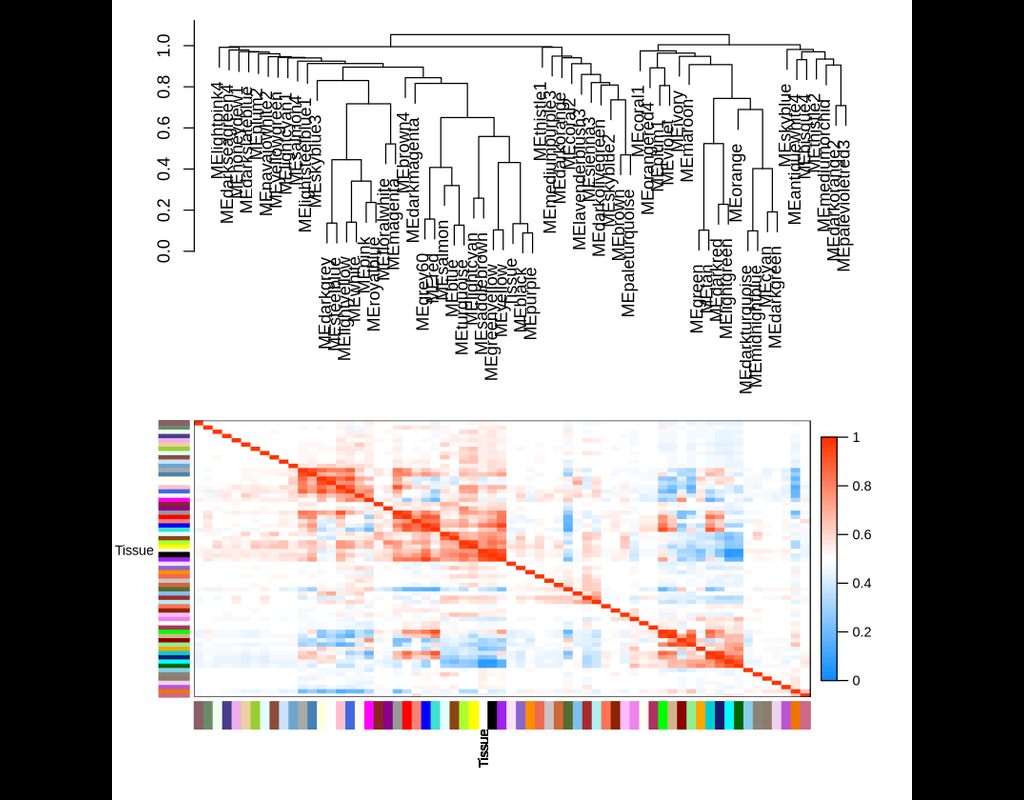
WGCNA: an R package for Weighted Gene Correlation Network Analysis
Correlation networks are increasingly being used in bioinformatics applications. For example, weighted gene co-expression network analysis is a systems biology method for describing (More)