


Notebooks

Categories


Cells
Premium


BioTuring
Charting an organs’ biological atlas requires us to spatially resolve the entire single-cell transcriptome, and to relate such cellular features to the anatomical scale. Single-cell and single-nucleus RNA-seq (sc/snRNA-seq) can profile cells comprehensively, but lose spatial information.
Spatial transcriptomics allows for spatial measurements, but at lower resolution and with limited sensitivity. Targeted in situ technologies solve both issues, but are limited in gene throughput. To overcome these limitations we present Tangram, a method that aligns sc/snRNA-seq data to various forms of spatial data collected from the same region, including MERFISH, STARmap, smFISH, Spatial Transcriptomics (Visium) and histological images.
**Tangram** can map any type of sc/snRNA-seq data, including multimodal data such as those from SHARE-seq, which we used to reveal spatial patterns of chromatin accessibility. We demonstrate Tangram on healthy mouse brain tissue, by reconstructing a genome-wide anatomically integrated spatial map at single-cell resolution of the visual and somatomotor areas.
BioTuring
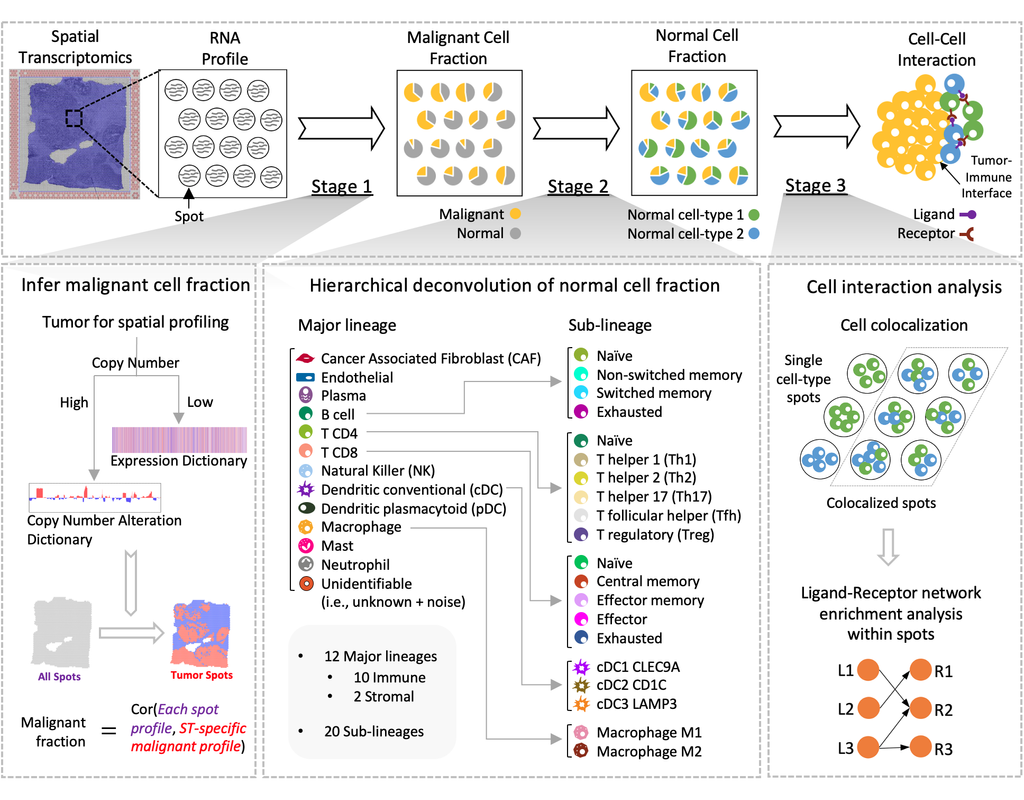
Spatial transcriptomics (ST) technology has allowed to capture of topographical gene expression profiling of tumor tissues, but single-cell resolution is potentially lost. Identifying cell identities in ST datasets from tumors or other samples remains challenging for existing cell-type deconvolution methods.
Spatial Cellular Estimator for Tumors (SpaCET) is an R package for analyzing cancer ST datasets to estimate cell lineages and intercellular interactions in the tumor microenvironment. Generally, SpaCET infers the malignant cell fraction through a gene pattern dictionary, then calibrates local cell densities and determines immune and stromal cell lineage fractions using a constrained regression model. Finally, the method can reveal putative cell-cell interactions in the tumor microenvironment.
In this notebook, we will illustrate an example workflow for cell type deconvolution and interaction analysis on breast cancer ST data from 10X Visium. The notebook is inspired by SpaCET's vignettes and modified to demonstrate how the tool works on BioTuring's platform.
BioTuring
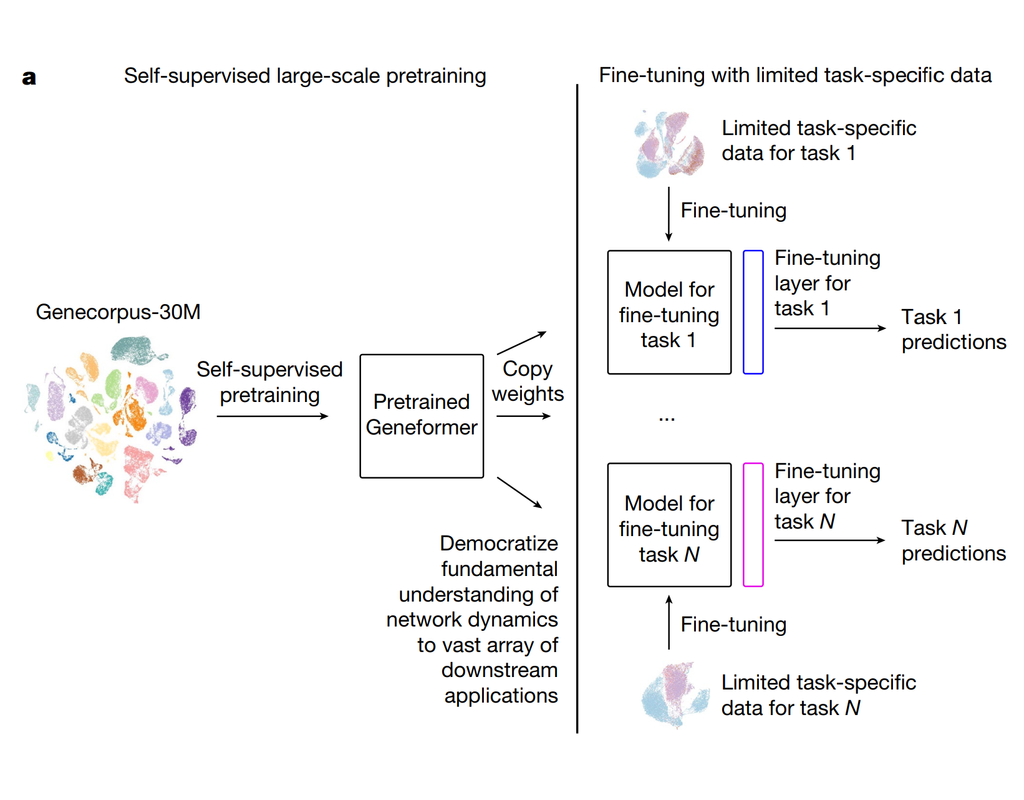
Geneformer is a foundation transformer model pretrained on a large-scale corpus of ~30 million single cell transcriptomes to enable context-aware predictions in settings with limited data in network biology. Here, we will demonstrate a basic workflow to work with ***Geneformer*** models.
These notebooks include the instruction to:
1. Prepare input datasets
2. Finetune Geneformer model to perform specific task
3. Using finetuning models for cell classification and gene classification application

BioTuring
Power analyses are considered important factors in designing high-quality experiments. However, such analyses remain a challenge in single-cell RNA-seq studies due to the presence of hierarchical structure within the data (Zimmerman et al., 2021). As cells sampled from the same individual share genetic and environmental backgrounds, these cells are more correlated than cells sampled from different individuals. Currently, most power analyses and hypothesis tests (e.g., differential expression) in scRNA-seq data treat cells as if they were independent, thus ignoring the intra-sample correlation, which could lead to incorrect inferences.
Hierarchicell (Zimmerman, K.D. and Langefeld, C.D., 2021) is an R package proposed to estimate power for testing hypotheses of differential expression in scRNA-seq data while considering the hierarchical correlation structure that exists in the data. The method offers four important categories of functions: data loading and cleaning, empirical estimation of distributions, simulating expression data, and computing type 1 error or power.
In this notebook, we will illustrate an example workflow of Hierarchicell. The notebook is inspired by Hierarchicell's vignette and modified to demonstrate how the tool works on BioTuring's platform.
Trends
BioTuring
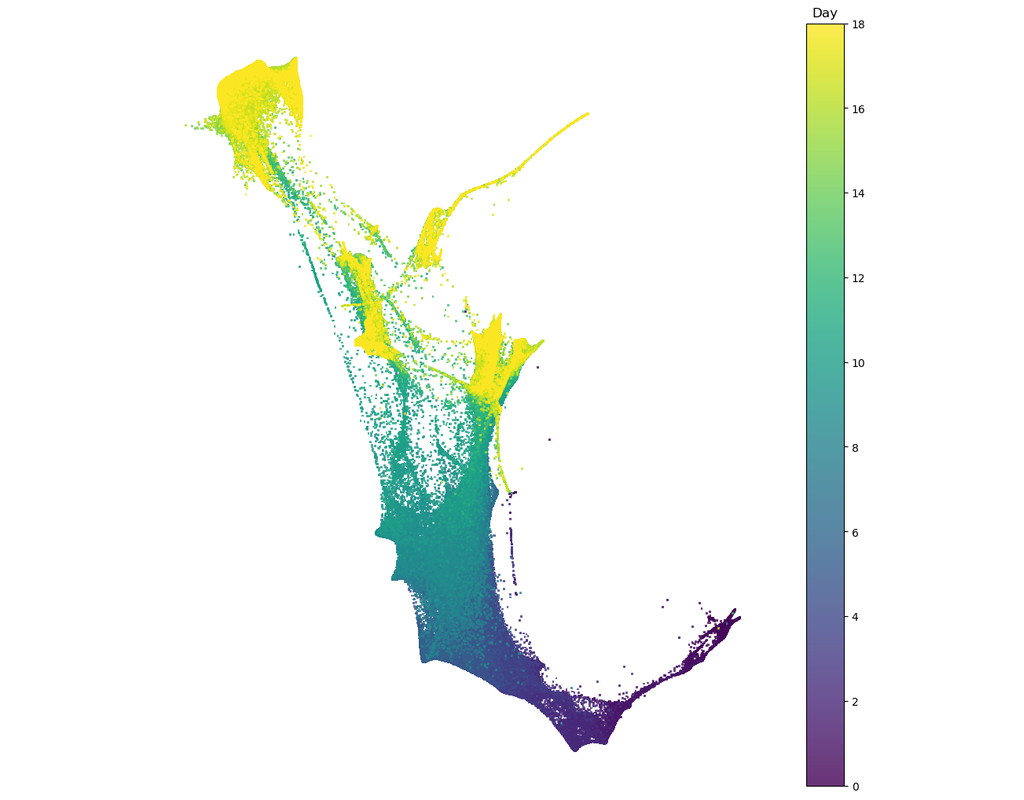
Single cell RNA-seq allows us to profile the diversity of cells along a developmental time-course. However, we cannot directly observe cellular trajectories because the measurement process is destructive. Waddington-OT is designed to infer the tempor(More)