


Notebooks

Categories


Cells
Premium

BioTuring
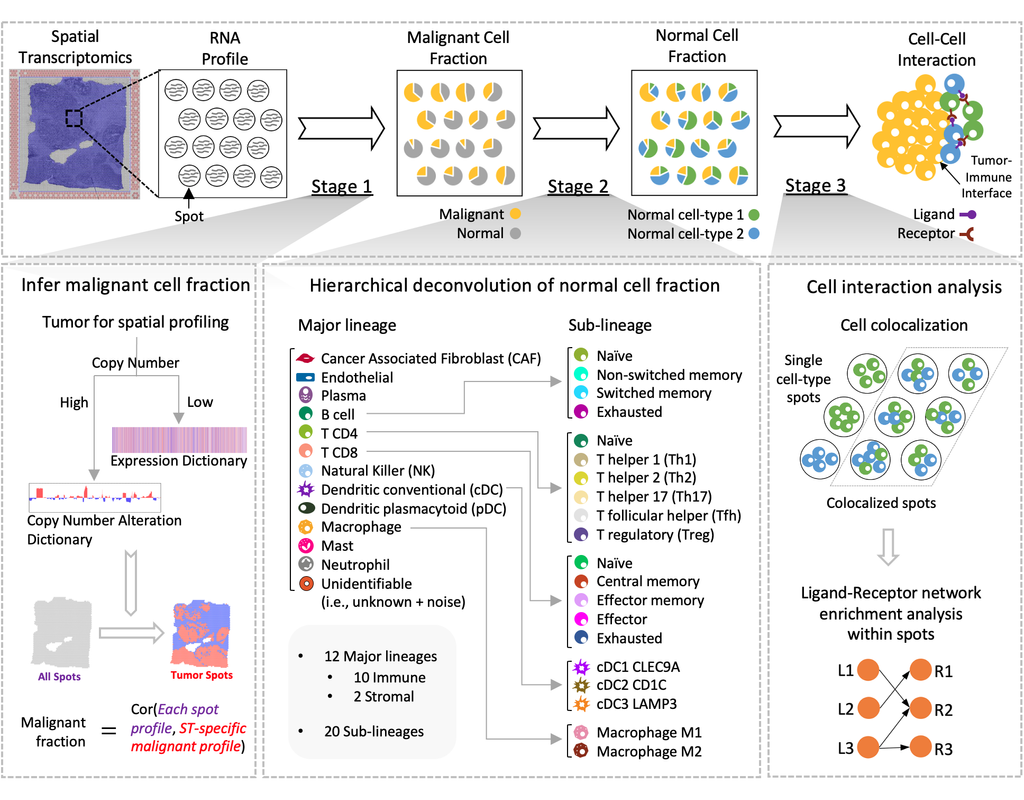
Spatial transcriptomics (ST) technology has allowed to capture of topographical gene expression profiling of tumor tissues, but single-cell resolution is potentially lost. Identifying cell identities in ST datasets from tumors or other samples remains challenging for existing cell-type deconvolution methods.
Spatial Cellular Estimator for Tumors (SpaCET) is an R package for analyzing cancer ST datasets to estimate cell lineages and intercellular interactions in the tumor microenvironment. Generally, SpaCET infers the malignant cell fraction through a gene pattern dictionary, then calibrates local cell densities and determines immune and stromal cell lineage fractions using a constrained regression model. Finally, the method can reveal putative cell-cell interactions in the tumor microenvironment.
In this notebook, we will illustrate an example workflow for cell type deconvolution and interaction analysis on breast cancer ST data from 10X Visium. The notebook is inspired by SpaCET's vignettes and modified to demonstrate how the tool works on BioTuring's platform.

BioTuring
Power analyses are considered important factors in designing high-quality experiments. However, such analyses remain a challenge in single-cell RNA-seq studies due to the presence of hierarchical structure within the data (Zimmerman et al., 2021). As cells sampled from the same individual share genetic and environmental backgrounds, these cells are more correlated than cells sampled from different individuals. Currently, most power analyses and hypothesis tests (e.g., differential expression) in scRNA-seq data treat cells as if they were independent, thus ignoring the intra-sample correlation, which could lead to incorrect inferences.
Hierarchicell (Zimmerman, K.D. and Langefeld, C.D., 2021) is an R package proposed to estimate power for testing hypotheses of differential expression in scRNA-seq data while considering the hierarchical correlation structure that exists in the data. The method offers four important categories of functions: data loading and cleaning, empirical estimation of distributions, simulating expression data, and computing type 1 error or power.
In this notebook, we will illustrate an example workflow of Hierarchicell. The notebook is inspired by Hierarchicell's vignette and modified to demonstrate how the tool works on BioTuring's platform.

BioTuring
Mapping out the coarse-grained connectivity structures of complex manifolds
Biological systems often change over time, as old cells die and new cells are created through differentiation from progenitor cells. This means that at any given time, not all cells will be at the same stage of development. In this sense, a single-cell sample could contain cells at different stages of differentiation. By analyzing the data, we can identify which cells are at which stages and build a model for their biological transitions.
By quantifying the connectivity of partitions (groups, clusters) of the single-cell graph, partition-based graph abstraction (PAGA) generates a much simpler abstracted graph (PAGA graph) of partitions, in which edge weights represent confidence in the presence of connections.
In this notebook, we will introduce the concept of single-cell Trajectory Analysis using PAGA (Partition-based graph abstraction) in the context of hematopoietic differentiation.
BioTuring
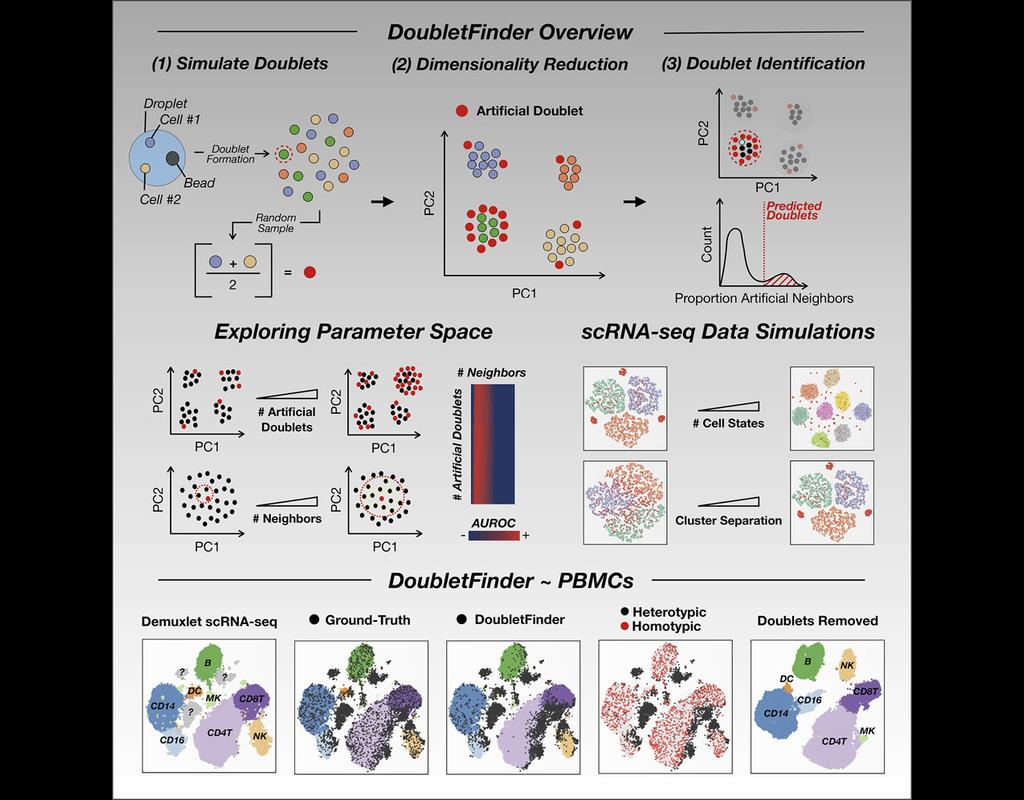
Single-cell RNA sequencing (scRNA-seq) data often encountered technical artifacts called "doublets" which are two cells that are sequenced under the same cellular barcode.
Doublets formed from different cell types or states are called heterotypic and homotypic otherwise. These factors constrain cell throughput and may result in misleading biological interpretations.
DoubletFinder (McGinnis, Murrow, and Gartner 2019) is one of the methods proposed for doublet detection. In this notebook, we will illustrate an example workflow of DoubletFinder. We use a 10x Genomics dataset which captures peripheral blood mononuclear cells (PBMCs) from a healthy donor stained with a panel of 31 TotalSeq™-B antibodies (BioLegend).
Trends

BioTuring
Many spatially resolved transcriptomic technologies do not have single-cell resolution but measure the average gene expression for each spot from a mixture of cells of potentially heterogeneous cell types.
Here, we introduce a deconvolution metho(More)